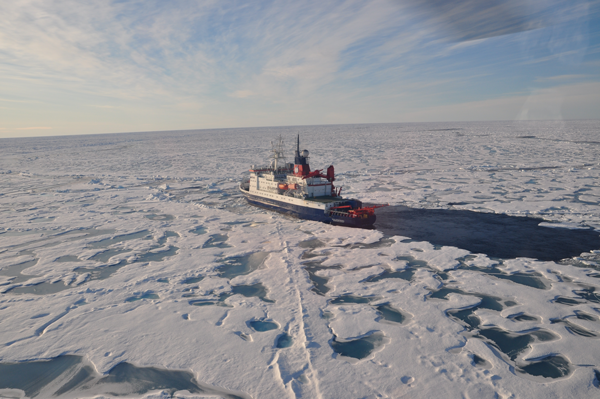
Nicolas Cassar, assistant professor in Duke University’s Nicholas School of the Environment, stands on sea ice over the North Pole during an expedition last summer to collect data on carbon export from ocean surfaces to the deep. Cassar is one of the Duke faculty members who will work with RENCI through the Program in Applied Scientific and Information Visualization.
DURHAM, NC—Two Duke University research projects—one that uses virtual environments to combat the Type 2 diabetes epidemic and another that aims to understand the role of the oceans in global climate change—will get a boost from RENCI scientific visualization experts as they work to understand complex, multidimensional datasets.
On June 1, the projects will become part of the RENCI@Duke Faculty Engagement Program in Applied Scientific and Information Visualization, an effort to expand the use of visualization tools and technologies among Duke researchers. Each research team will receive $12,000 from RENCI to support their work over the next year. The researchers will work with RENCI on visualization projects that are expected to lead to new research methods, models, applications, or prototypes as well as larger collaborative projects supported by grant money.
The projects are:
- Visualization of Multidimensional Data Obtained From a Virtual Environment Intervention
Constance M. Johnson, assistant professor, School of Nursing
Allison Vorderstrasse, assistant professor, School of Nursing
Johnson and Vorderstrasse developed a virtual environment (VE) designed to help patients with Type 2 diabetes understand and control their disease. The environment allows the patients to interact with other patients and clinicians, form social connections, explore diabetes educational resources, and take part in educational sessions.
Above: The avatars of Constance M. Johnson (left) and Allison Vorderstrasse, both assistant professors in the Duke University School of Nursing, navigate through a grocery store in the virtual environment they have created for diabetes patients.
Over the past year, the researchers gathered data on a group of adults with Type 2 diabetes, tracking their interactions, how they used resources and educational materials, and the connections made with other users. According to Johnson and Vorderstrasse, their preliminary results show VEs have potential to help patients manage their diabetes. However, the researchers want a more in-depth look at the data to better understand what makes the virtual world effective.
RENCI will work with the team to create visualizations across space and time that track oral and text conversations and the movement of avatars as they explore the environment, make choices, and form groups and social networks. By visualizing this data, the researchers hope to understand the social structures that developed in the VE and their impact on patients’ abilities to manage their disease. The collaboration could break new ground in visualizing multidimensional data from VEs and enable new research using larger VEs.
“Visualizing our data is essential to understanding how our study participants used the virtual world and how it affected them, and it will help us figure out the best ways to model the data,” said Johnson. Vorderstrasse added, “This kind of environment has great potential to help people with diabetes, especially those who aren’t able to have regular face-to-face interactions with their healthcare providers or other people living with this chronic disease. It could bring a support system to underserved communities and potentially reduce healthcare costs.”
Toward a Mechanistic Understanding of Carbon Export From the Surface Oceans: Advanced Geographical and Visualization Analysis
Nicolas Cassar, assistant professor, earth and ocean sciences, Nicholas School of the Environment
Cassar studies carbon export, the process by which marine phytoplankton sucks carbon dioxide (CO2) from the atmosphere and converts it to organic carbon, which then settles to the deep ocean floor. The process is central to the distribution of carbon between the atmosphere and deep oceans, and scientists ultimately want to understand how global climate change might affect this “oceanic biological pump.”
Above: The German icebreaking research vessel Polarstern on its voyage around the North Pole last summer. Duke researcher Nicolas Cassar collected data on that expedition.
Along with collaborators, Cassar’s research team developed a new way to accurately measure carbon export from ocean surfaces to the deep and has collected a very large number of measurements of dissolved gases in seawater on multiple cruises to the waters around Antarctica, the Pacific, Atlantic and Arctic oceans. They have assembled an extensive dataset on surface ocean carbon export and will work with RENCI to analyze and visualize it.
First, RENCI visualization experts will help Cassar’s team build a Web-based, interactive map from the data, which will allow researchers worldwide to access and query the database and to contribute their own data. Next, RENCI will visualize the data to show the geographic variability of surface ocean carbon export. That variability will be mapped to data obtained from NASA satellites on ocean temperature, chlorophyll, light availability at the ocean surface, and organic carbon at the surface.
The visualizations will be the first step in developing a carbon export map of the entire Antarctic region and, eventually, of all the oceans, according to Cassar.
“We hope to create an innovative and intuitive approach to geographically analyze and compare these measurements, and, in the long term, gain important insights into what drives carbon export from the surface ocean,” said Cassar. “We envision our RENCI collaboration leading to new research opportunities that will help us understand and predict the role of the oceans in future climate change.”
About RENCI@Duke
RENCI@Duke supports the use of visualization technology and advanced computational methods to explore issues in science, engineering, the arts, humanities and social sciences. Centrally located in the TelCom Building on Duke’s West Campus, the facility features visualization systems, high-definition videoconferencing and networking capabilities, and staff specializing in visualization and informatics. RENCI (Renaissance Computing Institute) develops and deploys cyberinfrastructure to enable research discoveries and practical innovations. Founded as a collaborative effort of Duke, North Carolina State University and UNC Chapel Hill, RENCI is an institute of UNC Chapel Hill.


