Current
Towards a Mechanistic Understanding of Carbon Export from the Surface Oceans: Advanced Geographical and Visualization Analyses
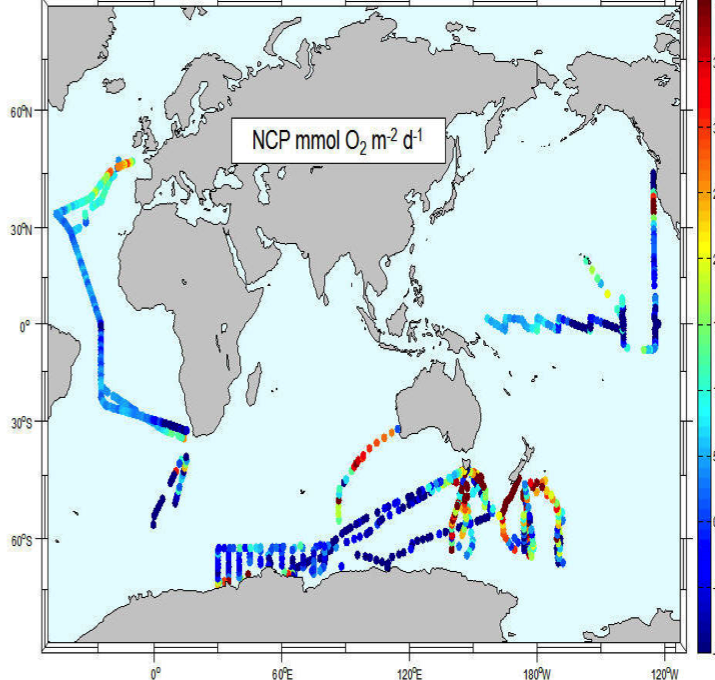
Nicolas Cassar, PhD, an assistant professor in the division of Earth and ocean sciences in Duke’s Nicholas School of the Environment, has partnered with RENCI to explore geographical variations in oceanic carbon export. Cassar and his team are gathering and analyzing chemical and physical data measurements on variables such as ocean salinity and temperature which are likely to indicate the speed and nature of processes which shape the transference of carbon between the atmosphere and the ocean’s surface. Since the Earth’s surface is 70% water, these measurements promise to contribute significantly to our understanding of climate change as shaped by the presence of atmospheric carbon dioxide. RENCI visualization experts are helping Cassar and his team to create a web-based interactive map and database, which allows researchers to access and query current carbon export-related measurements as well as enter new information. The researchers are studying the geographic patterns in oceanic carbon export by using the map to identify areas of variability and observe their surface ocean properties in relation to other factors, such as ocean depth. The project will help researchers all over the world study the impact of chemical interactions between the atmosphere and ocean on CO2 distribution.
Visualization of Multidimensional Data Obtained from a Virtual Environment Intervention
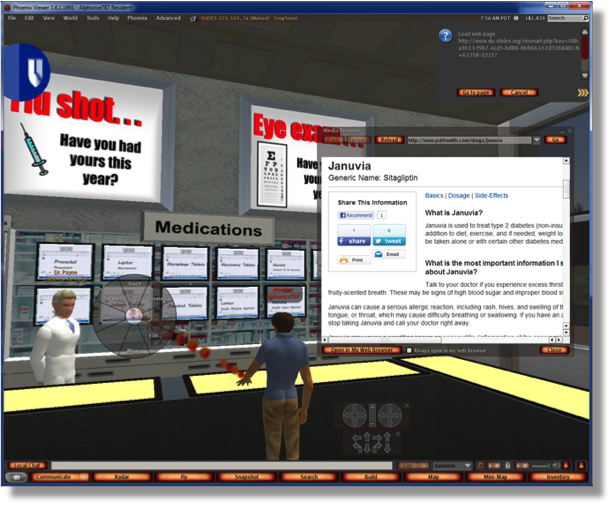 Constance Johnson, PhD, associate professor and Allison Vorderstrasse, DNSc, assistant professor, both of the Duke School of Nursing are collaborating with RENCI to visualize data acquired from an interactive virtual environment that they developed to help patients with Type 2 diabetes understand and control their disease. This immersive virtual community allows patients to interact with each other and with clinicians, form social connections, and explore diabetes educational resources. The team is using these visualizations to analyze data on the patients’ participation along with a wide variety of other data. The goal is to understand the impact of the social structures that develop, and how they impact patients’ management of their disease. The visualizations are being used as a basis for future larger intervention studies, in which RENCI is also participating.
Completed Projects
Visualization for Knowledge-Based Treatment Planning for Prostate Cancer
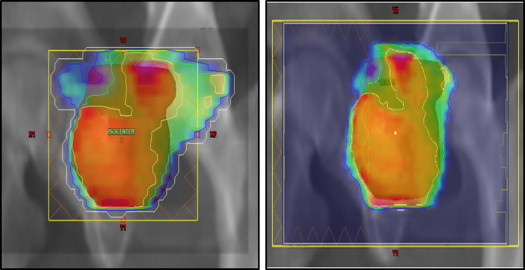
Joseph Lo, PhD, an associate research professor of radiology and biomedical engineering and Shiva Das, PhD, a professor of radiation oncology in the medical physics department, worked with RENCI software developer Steve Chall to design a tool that allows clinicians to visualize and analyze a large dataset of prostate cancer cases in order to develop better treatment plans for new patients. The software can help clinicians view radiation therapy effects in as many ways as possible in order to spare healthy tissue from radiation beams as much as possible during treatment.
Read more abut the outcome of the project here.
Visualizing Historical Materials
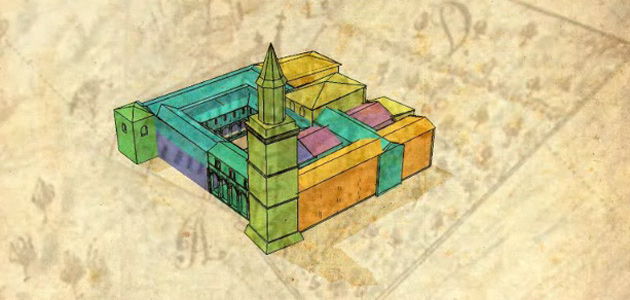
RENCI assisted Caroline Bruzelius, PhD, an art and art history professor, with designing a 3D relational database for ancient and medieval structures that linked to the place they were originally displayed. The visualizations included the history and development of Venice, Italy, and the construction of the Franciscan Churches of Campania in Florence, Italy. The database also served as a shared repository of assets (documents, images, 3D models, maps), and provided a space for archival gallery publishing.
Visualizing Art Markets
RENCI staff helped Victoria Szabo, program director in the Duke department of art, art history, and visual studies (AAHVS) apply information visualization techniques to the study of emerging art markets. A team from the Duke Visual Studies Initiative created a collaborative infrastructure to analyze the flows of art markets in early modern Europe in order to understand how these markets emerged and grew. The database-driven visualization tool incorporated a variety of media to be as comprehensive and user-friendly as possible, and then integrated them into the information visualization program for use by other VSI scholars.